# Project Analytics
Within Cartographer, there is an Analytics package that is included. Each recommender has its analytics dashboard that tracks performance and engagement of sessions and products. In addition, Cartographer provides engagement details of the questions and their respective answers for each recommender.
Analytics can be accessed in a couple of ways. One is through the home page under the Projects section:

The other is located in the Project Editor of the recommender, towards the top of the page. Click on the button “Project Analytics” and it will take you to the main analytics dashboard.
The following sections go into details of the various metrics that are tracked within Cartographer.
# Product Metrics
Within the main analytics dashboard, there is a section on "Sessions and Products".
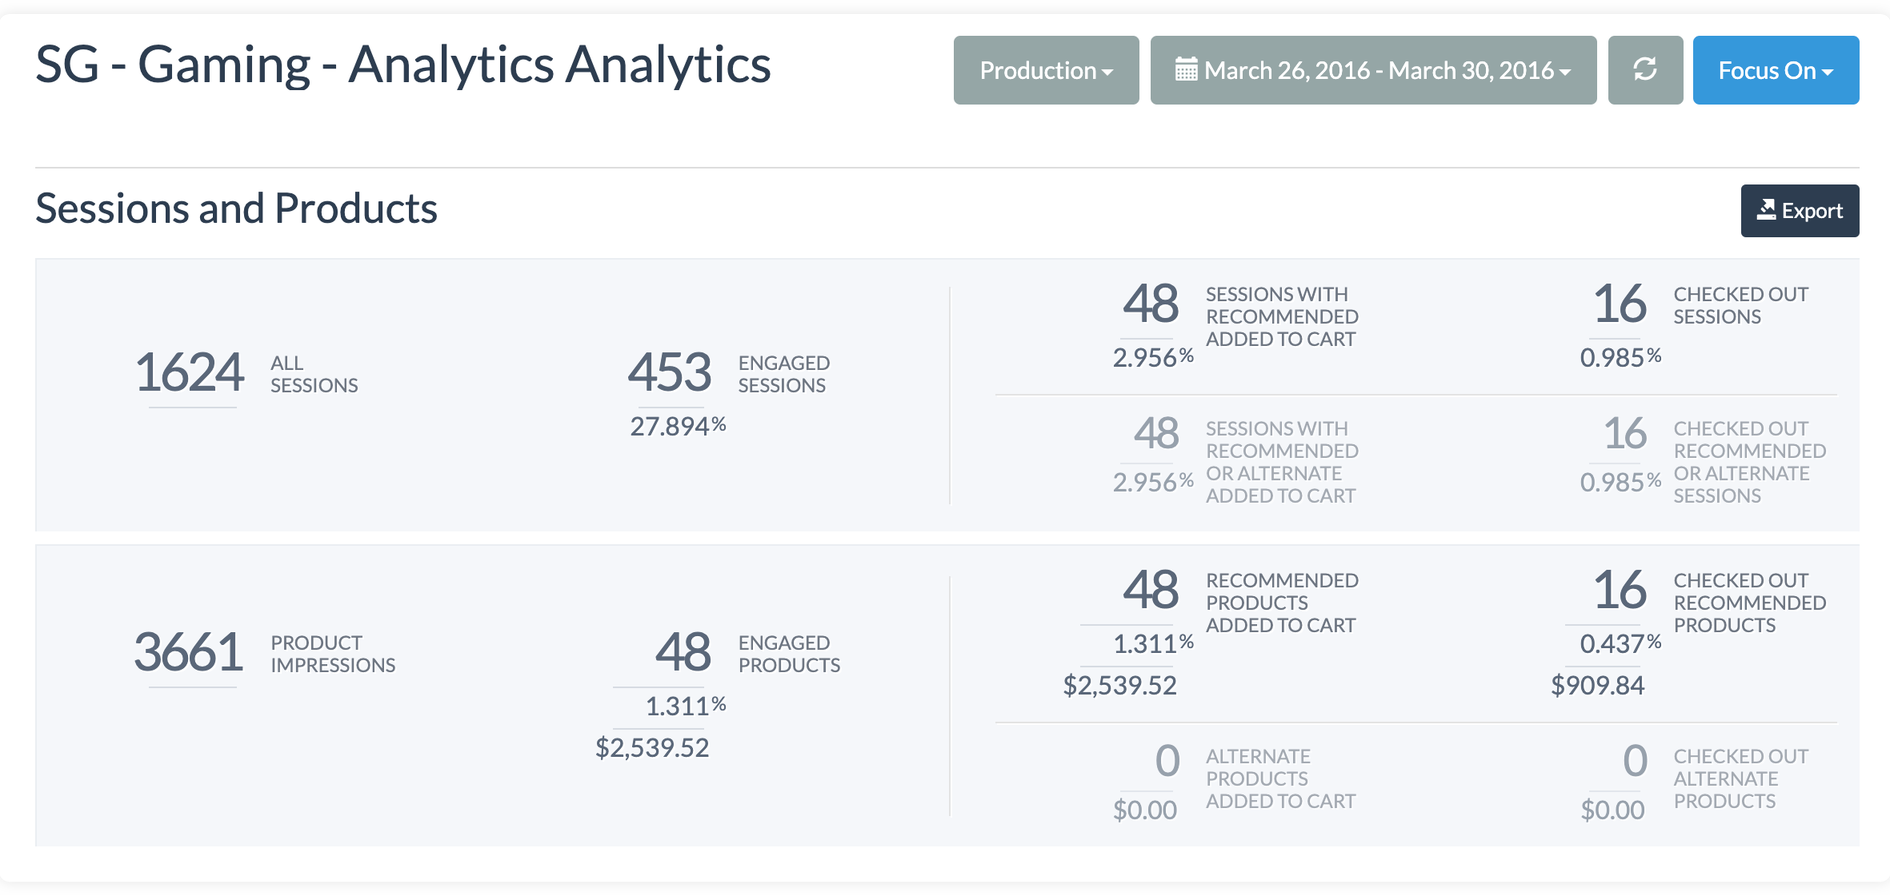
Before diving into the definitions of each metric, there are two types of "Products" Cartographer recognizes - Recommended and Alternate Products. Recommended Products are the products that are returned in the results or recommendations section in the recommender. For example, you went through a recommender to find the best shoe for your activity need, the final product(s) displayed in the results will be counted as a Recommended Product(s). Note that the window for a product to be recognized as “Recommended” is 6 hours.
On the other hand, Alternate Products are not a part of the recommended set of products, but are the products customers discovered due to their engagement with the quiz/recommender. For example, you went through the same shoe recommender, but discovered other shoes that were not specifically recommended in the results section. Engagements with these products will be counted towards the Alternate Product bucket. Also, to note, if a product recommendation is received, after a customer goes through the recommender, then checked out after the 6-hour window, Cartographer will count this product as an Alternate Product.
The distinction between these two product types is how some of the metrics listed below are broken out and should be noted depending on what insights you want to gather.
Below are the definitions:
- Product Impressions: Shows how many products were seen by customers that completed the quiz/recommender over a period of time (default is last 30 days)
- Note: If there are multiple products recommended, product impressions only track products that are displayed on the first page. In other words, if recommended products are displayed on multiple pages, impressions won't track those additional pages.
- Engaged Products: Displays the number, %, and $ amount of all product impressions that customers interacted with in the quiz/recommender over a period of time
- Recommended Products Added to Cart: Number, %, and $ amount of recommended products added to a customer's cart over a period of time
- Alternate Products Added to Cart: Number and $ amount of alternate products (products that weren't part of the recommended set of products but customers discovered due to their engagement with the quiz/recommended) added to carts over a period of time
- Checked Out Recommended Products: Number, %, and $ amount of recommended products that were checked out over a period of time
- Checked Out Alternate Products: Number and $ amount of alternate products that were checked out over a period of time
# Session Metrics
The other metrics tracked in the main Analytics dashboard are for sessions. Again, the distinction between Alternate and Recommender product types are broken out for some of the metrics listed below, depending on what insights you want to gather they should be noted.
Below are the definitions:
- All Sessions: Shows all customers that landed on the quiz/recommender over a period of time (default is last 30 days)
- Engaged Sessions: Displays the number and % of all sessions that interacted with at least 1 question in the quiz/recommender over a period of time
- Sessions with Recommended Added to Cart: Number/% of engaged sessions that had recommended products added to a customer's cart over a period of time
- Sessions with Recommended or Alternate Added to Cart: Number/% of engaged sessions that had recommended or alternate products added to their carts over a period of time
- Checked Out Sessions: Number/% of engaged sessions that checked out with a recommended product over a period of time
- Checked Out Recommended or Alternate Sessions: Number/% of engaged sessions that checked out with a recommended or alternate product over a period of time
In addition to the dashboard view for the Sessions and Product metrics, there is an “Export” option next to each chart/section to export the data into a spreadsheet. The spreadsheet breaks down daily metrics and has greater detail than what's displayed on the dashboard.
# Question Metrics
In the Project Editor screen, you are able to track how people have engaged with each answer choice. Every question will have a set of metrics listed to the left of each option choice. Hover over the percentages and a description and number count of sessions will appear to explain what is tracked.
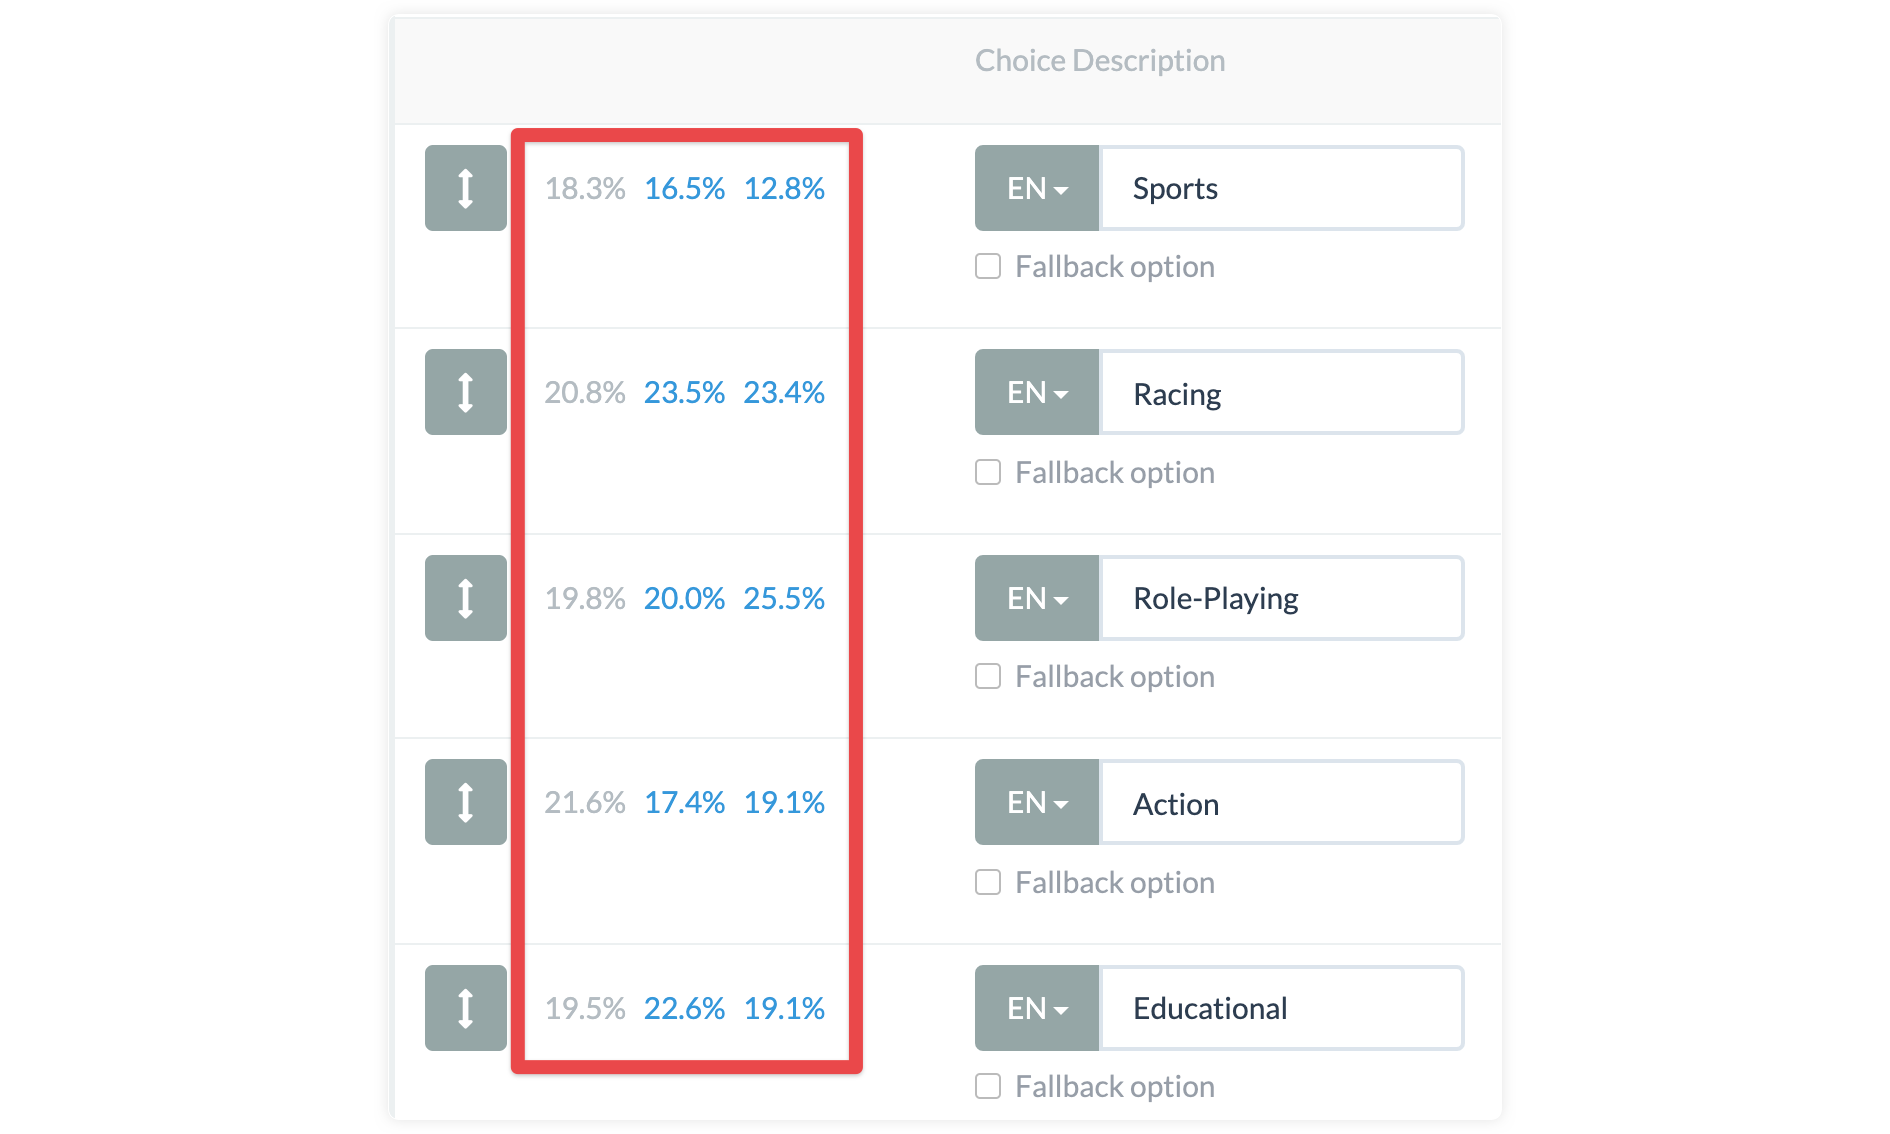 The first percentage is out of the total number of sessions that have taken the recommender, how many users answered this option. In the example below, 238 out of 1300 answers, or 18.3%, chose “Sports” as an answer.
The second percentage shows out of total sessions that answered this question what percentage of users interacted with a recommended product. In the example below, 19 out 115 answers, or 16.5%, who answered “Sports”, interacted with a recommended product.

Finally, the last percentage represents that out of total sessions that answered this question what percentage of users performed an add to cart action. In the example, below 6 out of 47 answers, or 12.8% , who answered “Sports”, clicked on add to cart.

You also have an option to export question analytics in a spreadsheet, which breaks down daily metrics and has greater detail than what's displayed within the Project Editor itself. Click on the "Other Actions" menu at the top of the Project Editor and select "Export Question Analytics".